Computer application – PinovaSoft

The PinovaSoft application facilitates seamless communication between the sensors of the Pinova Weather Station and your computer. Each time you launch the PinovaSoft application on your computer, the most recent measured data is displayed in a highly intuitive graphical or tabular format.
What sets PinovaSoft apart from its competitors is the clarity of data presentation and the speed at which desired information can be accessed for various time periods. The application is designed for the transfer and processing of measured parameters, making it exceptionally easy to install and use. With just one click, you can calculate and display the average, minimum, and maximum values of the measured parameters within a selected time period.
In addition to the standard time intervals of 10 minutes, 2 hours, 6 hours, 1 day, 1 week, and 1 month, users can adjust the display for other periods (e.g., 10–50 minutes in 10-minute increments, 1–23 hours in 1-hour increments, 1–31 days in 1-day increments, 1 or 2 weeks, and 1–12 months in 1-month increments).
In report form, the application allows the review of the dew point in 10-minute intervals and evapotranspiration in a daily view.
PinovaSoft application enables:
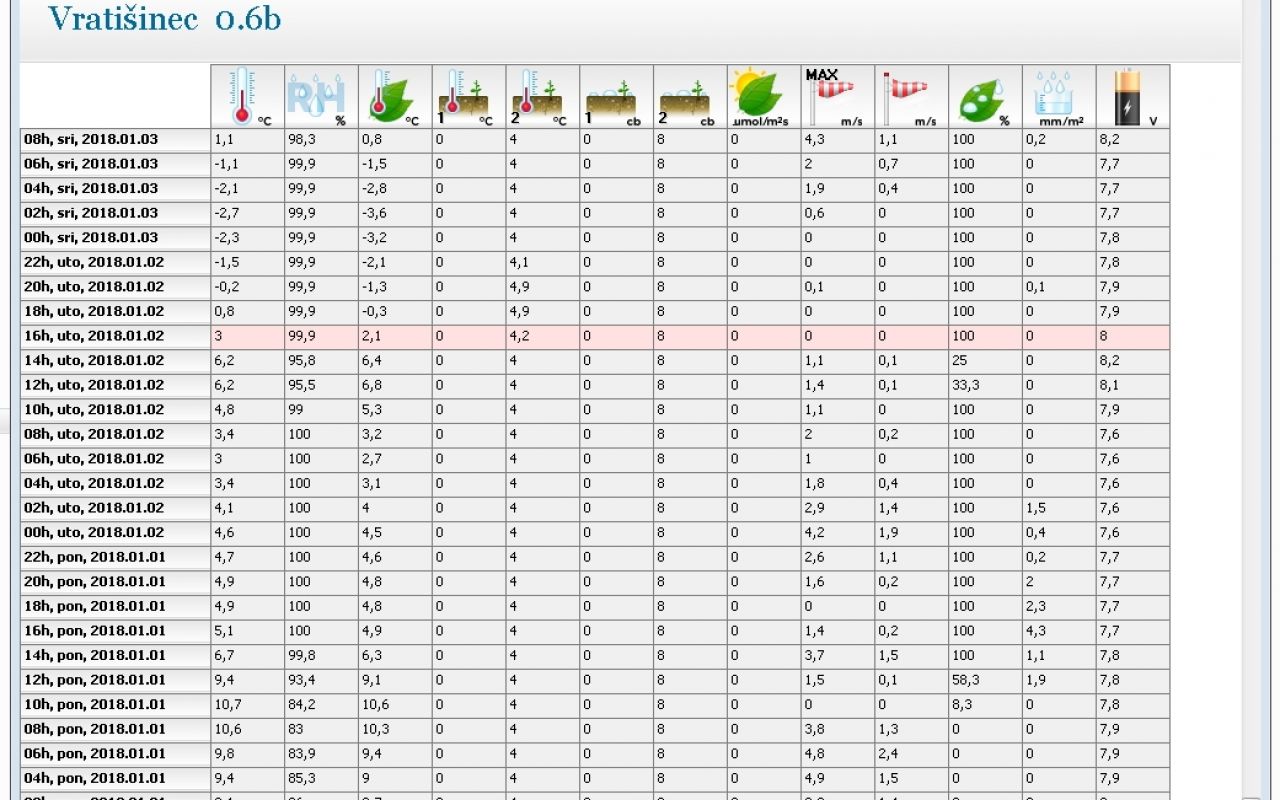
- Graphical or tabular viewing and printing of all data measured by the Pinova Weather Station in real time.
- Automatic calculation and graphical or tabular review of minimum, average, maximum, and/or cumulative data values across different time resolutions.
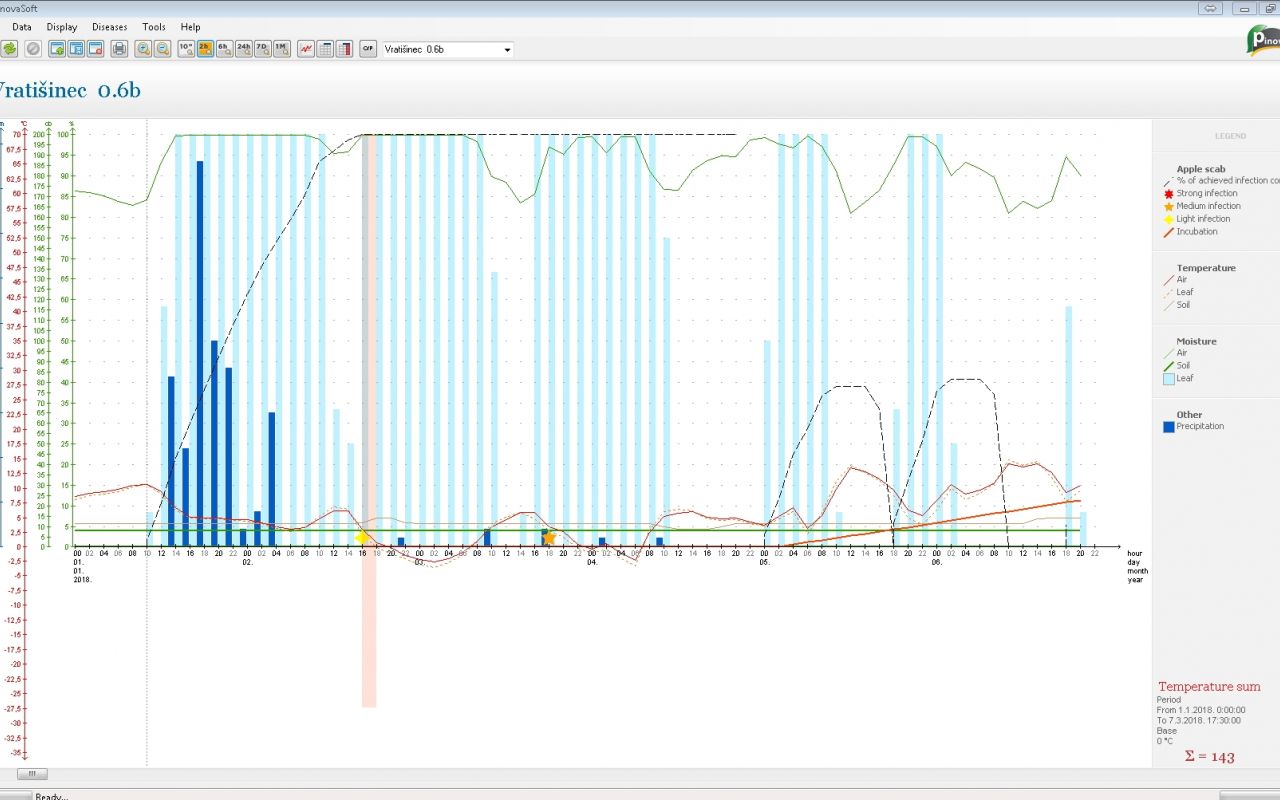
- Calculation of disease development forecasts for specific crops.
- Calculation of dew point and evapotranspiration.
- Calculation of temperature sums using the degree-hour or degree-day algorithm.
- Correction of inaccurately measured values due to errors in the station or sensors.
- Printing all measured values in graphical or tabular format on paper.
- The ability to add comments in the graphical display, allowing users to record applied treatments and products to better determine the next treatment timing and appropriate product.
PinovaSoft allows the review of the following measured and algorithmically calculated parameters:
- Exact date and time of measurement.
- Air temperature and relative humidity.
- Leaf wetness duration and temperature.
- Soil temperature and moisture.
- Precipitation amount.
- Wind speed and direction.
- Air pressure.
- Global solar radiation.
- Dew point.
- Evapotranspiration.
- Probability and percentage, and/or timing of infection (depending on the forecast model).
- Duration and stage of incubation (depending on the forecast model).
PinovaSoft is available in 7 different languages:
- Croatian
- English
- German
- Italian
- Ukrainian
- Russian
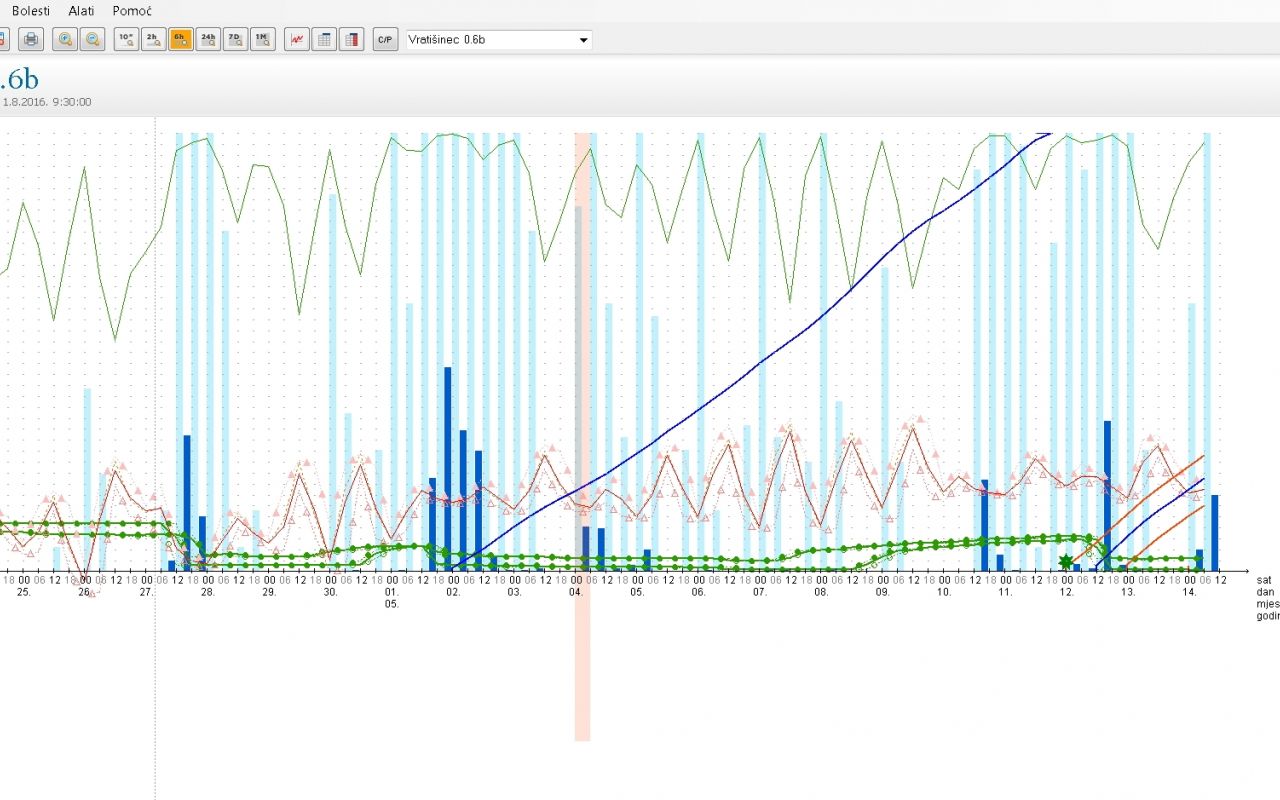
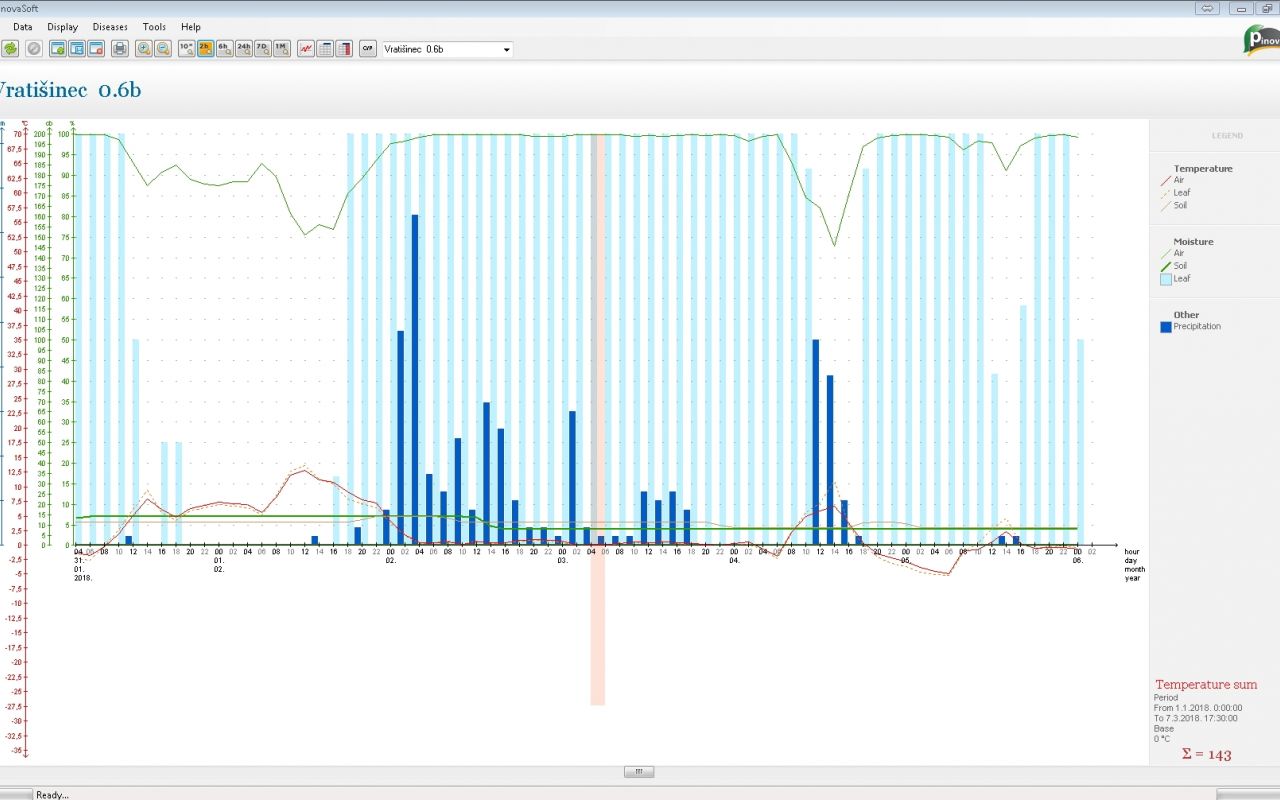
Screenshots of the application