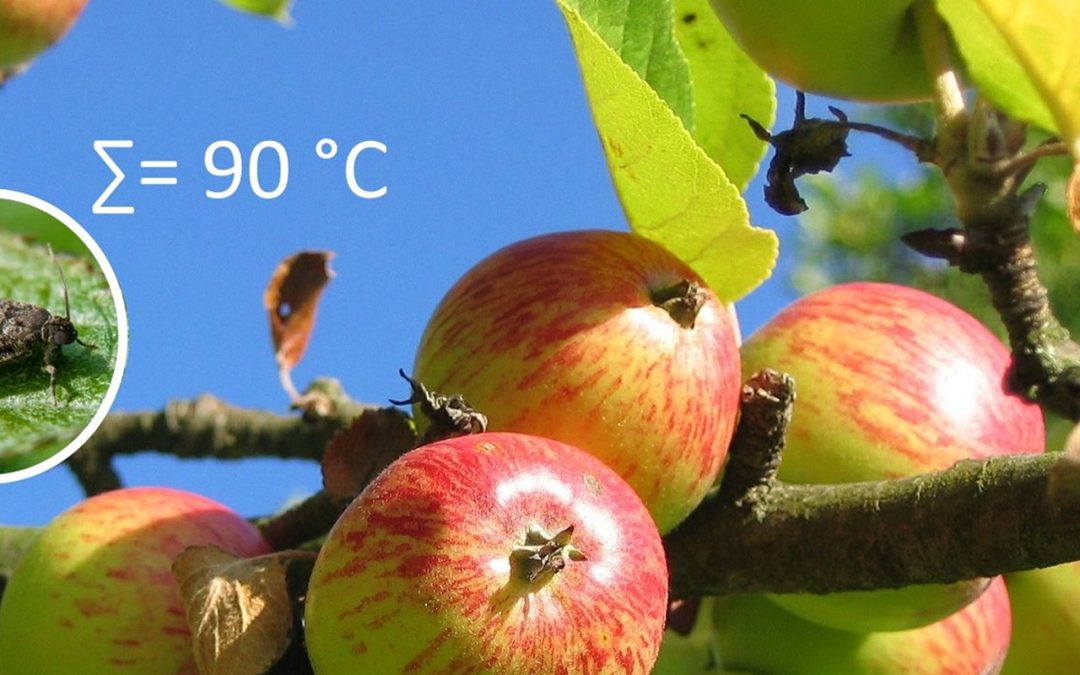
Simply put, the temperature sum represents accumulated heat energy over a period of time. Heat is one of the most important factors in the plant and animal world. Considering the fact that the heat can not be measured, while the temperature can, a model of effective temperature sums has been developed.
The accumulated air temperature over a period of time determines the growth and development of plants. To use the daily temperature for determination of phenophases, it was necessary to develop a model of effective temperature sums. According to the definition, temperature sums or degree days are a measurement that reflects on the accumulated heat above a specific temperature threshold in a particular period: day, month, in the warm or cold part of the year, from one to another developmental phase of a plant. The temperature sum is calculated by taking away the threshold from the average daily temperature – if we determine that the temperature threshold is 10 ºC and the average temperatures in 5 days were: 12, 14, 9, 11, 15 ºC, this would mean that the effective temperatures were 2, 4, 0, 1, 5 ºC and that the sum of the effective temperatures for that period was 12 ºC. Base temperature is determined based on the need, as in determining the maturation of grapevine, a biological minimum of 10 ºC is taken.
Examples of using the temperature sum in agriculture
Temperatures in agriculture can be used for different purposes:
- comparison of agricultural regions and the season,
- when starting a plantation and choosing varieties and types,
- development of plant diseases and pests,
- predicting the developmental phases of plants,
- determining the moment of performing agrotechnical operations and other.
Studies in the Netherlands and in England have shown that the optimal time for the application of nitrogen fertilizers to cereals is when the temperature sum is between 200 ºC and 300 ºC. The base temperature is set to 0 ºC and the values below 0 ºC are ignored. If the fertilizer is applied before the sum of temperatures reaches 200 ºC the results are not optimal.
When choosing a planting site, it is necessary to have information on the microclimate as well as the accumulated effective temperatures throughout the vegetation season. It is also important to know what the sum of the effective temperatures is for the blossoming and ripening of the fruits of a particular crop and variety.
When we compare these two data we find out easily whether the crop or variety suits the microclimate of the site. Apart from the temperature data, rainfall, winds, insolation, soil, groundwater, frequency of spring frost and other factors are as well considered key data. At locations where there is a greater risk of spring frost, it is preferable to choose crops or varieties that begin to blossom later, to reduce the risk of freezing.
Grapevine and temperature sums
One of the limiting climatic factors for grape growing is temperature or in other words, heat. It is common that the average annual temperature is taken as an indicator, but from the wine growing aspect, it has been proved as insufficient. The sum of effective temperatures with a biological minimum (temperature threshold) of 10 ºC has shown as the best replacement for average temperature. The vegetation period for grapevine lasts from the beginning of April to the end of October. According to Winkler (1974), all vineyards in the world are divided into 5 climatic zones based on effective temperatures (table below).
| Climatic zone | Effective temperature sum | Wine growing regions in the world | Wine growing (sub)regions in Croatia |
| I | < 1371 ºC | Tasmania, Champagne, Burgundy Friuli, Chablis | Moslavina, Prigorje-Bilogora Plešivica, Pokuplje i Zagorje-Međimurje |
| II | 1372 – 1648 ºC | Yarra Valley, Alsace, Boredeaux, Napa | Slavonija i Podunavlje |
| III | 1649 – 1926 ºC | Rioja, Piemonte, Clare Valley, Capetown, Barossa valley | Part of North Dalmatia and subregion Dalmatinska zagora |
| IV | 1927 – 2204 ºC | Langhore Creek, Montpellier, Florence, McLaren Vale, Provance | Istra, Croatian Littoral and a part of subregion of North Dalmatia |
| V | >2205 ºC | Sicily, Sardinia, Jerez, Swan Valley | Central and South Dalmatia – coastal island part |
The autochthonous varieties of some parts of the world are successfully grown in other areas as long as they are in the same climatic vineyard zone. As an example is the introduction of famous varieties (Grenache, Carignan, Syrah and others) of the Provance (France) wine-growing region to Ravne kotare near Zadar.
Breakdown by the sum of effective temperatures is particularly suitable for the selection of variety for a planting site/region. Specifically, grapevine varieties differ distinctly by the time of maturity, which is caused by their internal/genetic variability. Pulliat (1897) took into account the sum of the effective temperatures and divided the varieties according to the time of maturation in 5 groups:
- very early: 1000 – 1200 °C
- early: 1200 – 1350 °C
- medium late: 1351 – 1600 °C
- late: 1601 – 2000 °C
- very late: 2000 °C +
Early varieties mature at a lower sum of effective temperatures and are suitable for growing in climatic zones with lower summers of effective temperatures (Chardonnay varieties in the region of West continental Croatia), while the late ones require much more heat for maturation and can only reach its optimum in regions with a higher amount of effective temperatures (Plavac mali red variety in the region of Primorje Croatia).
| Type | Buds opening | Blooming |
| Chardonnay | ̴ 75 ºC | ̴ 345 ºC |
| Cabernet Sauvignon | ̴ 87 ºC | ̴ 375 ºC |
* [Temperature threshold 10 ºC, calculation starts on 01.03.]
Plant diseases and pests
As we have seen that heat influences the development of plants, it also affects the developmental cycle of plant pathogens and pests. Temperature sums are used to determine the maturity of oospores in grape vines. It is considered that oospores are mature when the sum is 160 to 170 ºC since the beginning of the calendar year with the temperature threshold of 8 ºC.
A study that was carried out in Turkey used temperature sums for determining the presence of grapevine moth. The results have shown that the first generation appeared around the accumulated 120 ºC, the second generation around 520 ºC and the third generation around 1047 ºC.
Pinova Meteo station with the help of your computer and a mobile app has an option to calculate the temperature sums. For more, click on PinovaMobile and PinovaSoft.
Tomislav Dvorski mag. ing. agr
References:
1. Historical and recent viticulture as a source of climatological knowledge in the czech republic (2008) R. BR¡ZDIL i sur.
2. Ekologija u službi vinogradarstva (1997). N. Fazinić, Melita Fazinić
3. Phenology and growing degree days, Mark Keller, Washington State University


